代码重构工具----perf火焰图
Write your description here.
views
| comments
写在前面的#
今天翻笔记的时候突然发现之间在华为上班的时候,彭涛哥介绍的一款很有用的代码重构工具----火焰图(perf),重新总结下,希望后面看起来有用!!!
火焰图的使用说明#
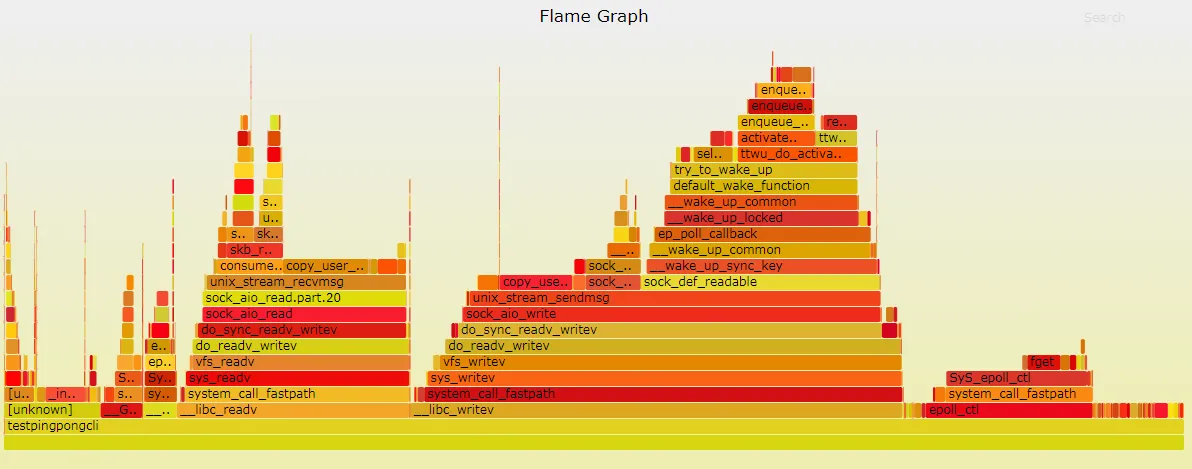
火焰图是什么
性能调优时,我们通常需要分析查找到程序百分比高的热点代码片段,这便需要使用perf record记录单个函数级别的统计信息,并使用perf report来显示统计结果。火焰图从下到上为对应的调用栈的顺序,perf主要看的是函数集在cpu上的运行时间,具体的优化可能还有看下具体的汇编指令。
命令示例
- 线程pid id获取
通过top工具可以查看到当前运行的工程的线程pid
或者通过下面的命令得到对应的热点函数
sudo perf top- 使用perf记录及分析性能
sudo perf record -g --call-graph dwarf -p pid
perf record- 将perf数据转换为火焰图
perf script -i perf.data | ./stackcollapse-perf.pl > perf.folded
./flamegraph.pl perf.folded > perf.svg- 使用perf统计cache miss 以及cpu cycles
sudo perf stat -e cache-misses.cache-references.cpu-cycles.instructions -p pid相关建议#
- 循环和公共计算提前
- 用整数来代替附浮点数运算
- 小函数记得使用
incline完成内联的声明